Plotting
import matplotlib.pyplot as plt
Create a figure
fig, ax = plt.subplots(figsize=(width,height)) #replace width and height by integers, e.g., 11, 8. Try to follow a x1.33 ratio.
Set the title to a specific ax
ax.set_title('Title', fontsize=19)
Modify the font-size of the ticks
plt.setp(ax.get_xticklabels(), fontsize=14)
plt.setp(ax.get_yticklabels(), fontsize=14)
Modify the limits of the axis x and y in ax
plt.setp(ax, yticks=np.arange(lower_limit, upper_limit, step= steps))
plt.setp(ax, xticks=np.arange(lower_limit, upper_limit, step= steps))
Add a space between subplots
fig.subplots_adjust(hspace=0.35)
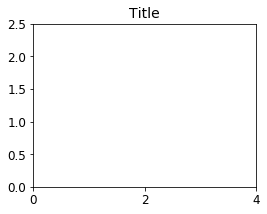
Example
import matplotlib.pyplot as plt

fig, ax = plt.subplots(figsize=(4,3))
ax.set_title('Title', fontsize=14)
plt.setp(ax.get_xticklabels(), fontsize=12)
plt.setp(ax.get_yticklabels(), fontsize=12)
plt.setp(ax, yticks=np.arange(0, 3, step= 0.5))
plt.setp(ax, xticks=np.arange(0, 6, step= 2))
plt.show()
Output:
Colours!
Tableau20 colors
tableau20 = [(23, 190, 207), (31, 119, 180),  (255, 187, 120), (148, 103, 189),
             (44, 160, 44), (152, 223, 138), (174, 199, 232),
             (255, 127, 14),(214, 39, 40), (255, 152, 150),
             (197, 176, 213), (140, 86, 75), (196, 156, 148),
             (227, 119, 194), (127, 127, 127), (199, 199, 199),
             (188, 189, 34), (219, 219, 141),  (158, 218, 229)]


# Scale the RGB values to the [0, 1] range, which is the format matplotlib accepts.
for i in range(len(tableau20)):
    r, g, b = tableau20[i]
    tableau20[i] = (r / 255., g / 255., b / 255.)